🚀 Trading Charts is live — real market data for your Figma designs →

Stop Faking Trading Charts in Figma.

note_stack

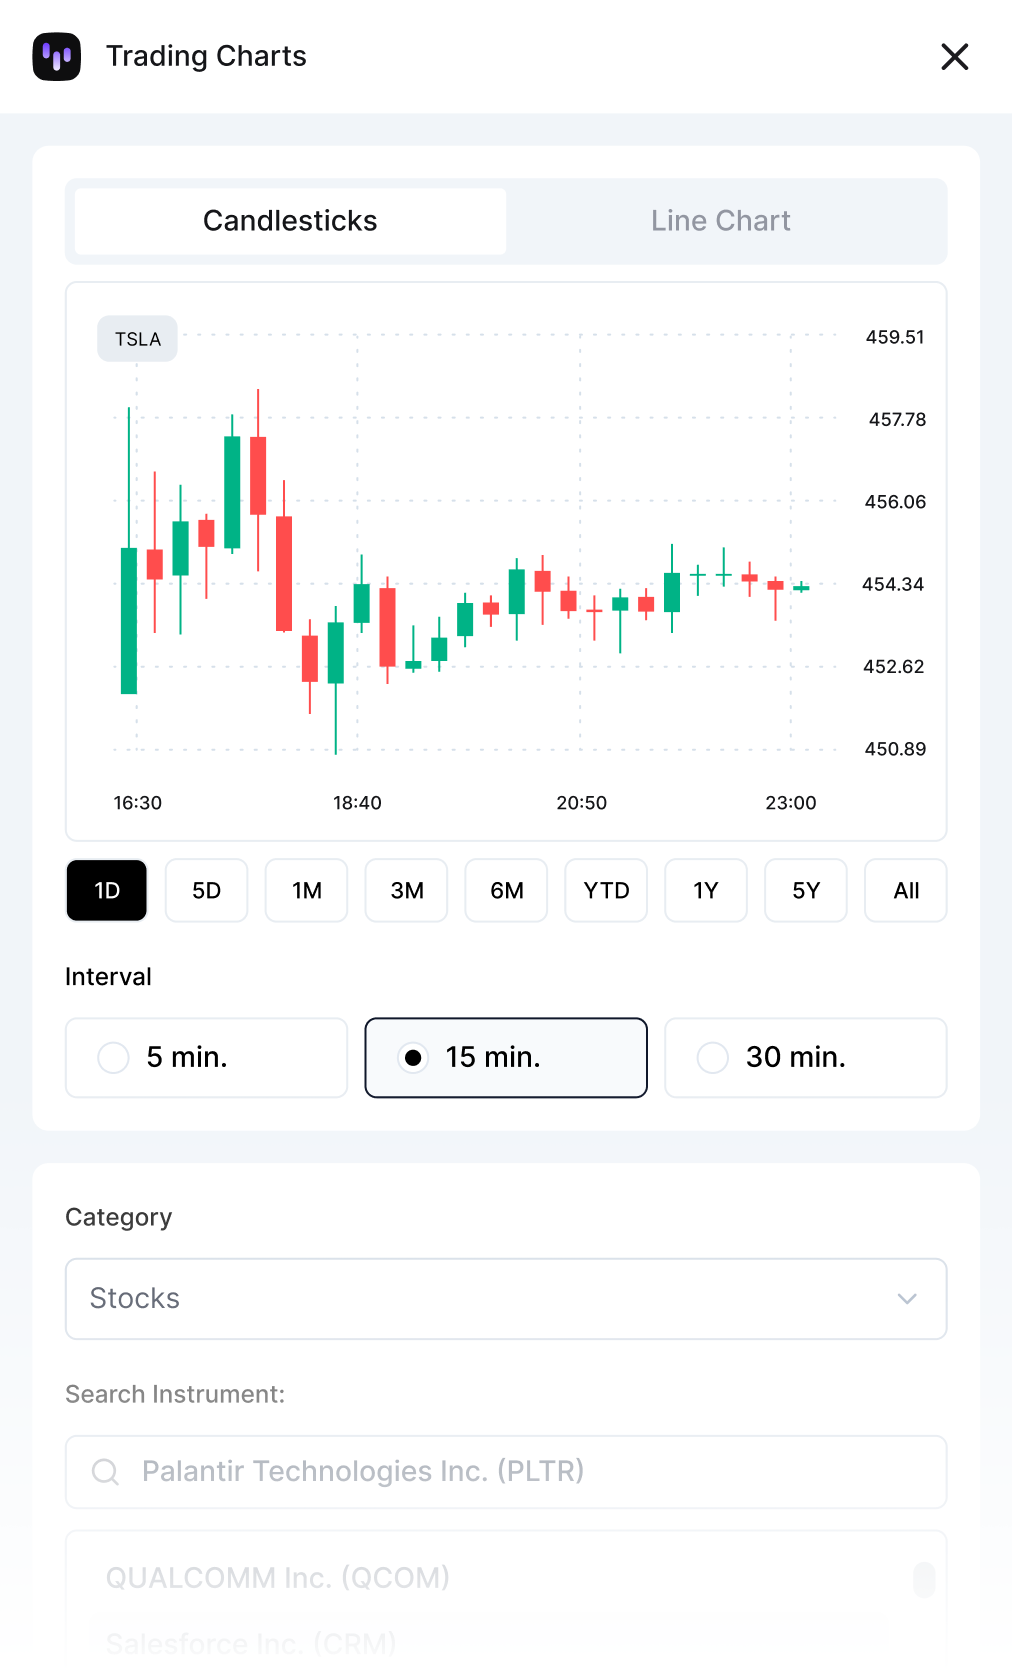
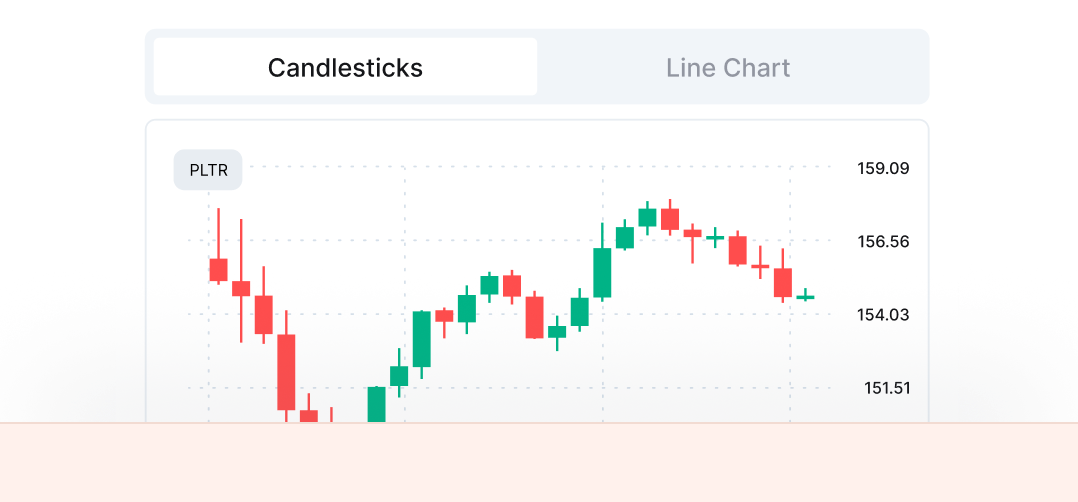
Hundreds of real instruments - Stocks, crypto, forex, commodities. Actual market data, not fake placeholders.

bolt

Charts in seconds - Stop wasting hours tracing screenshots or drawing fake candles.

wand_shine

Fully editable vectors - Change timeframes, instruments, colors. All native Figma elements.

candlestick_chart

Live data on demand - Pull fresh charts anytime. Always accurate, always current.

Trading chart interface showing Tesla candlestick stock prices with selected 1-day interval and 15-minute time frame.
Try it free. Upgrade when you're ready.

Free

$0

Start Free
5 charts/month
10 instruments (AAPL, WMT, SOLUSD, and more)

Pro

$15/mo

Upgrade to Pro
Unlimited charts
Full Instrument Database
Advanced Design Controls
Commercial License

Enterprise

$29/mo

Get Enterprise
Everything in Pro, plus:
Direct Developer Access
Influence the Roadmap
Early access to betas
Cancel anytime, no questions asked.
VAT Tax may apply. Secure payment via
Stripe logo

Every fintech designer knows this pain.

You're putting together a market update for a campaign. The deadline is tomorrow. You need a chart that looks like it belongs in your brand, not a screenshot you grabbed from TradingView and hoped nobody would notice.
So you either trace over a screenshot (tedious), draw fake candles by hand (time-consuming and wrong), or use a generic placeholder that makes your mockup look like a student project.

Trading Charts fixes this. Real OHLC data from hundreds of instruments, generated as editable vectors that actually match your design system. No more fake data. No more "I'll update that chart later" tickets that never get closed.

The Figma Chart Plugin for Professional Financial Data

Dropdown list showing company stock options including Palantir Technologies, Qualcomm, Salesforce, Taiwan Semiconductor, Tesla, Texas Instruments, and Thermo Fisher Scientific.
Hundreds of Instruments

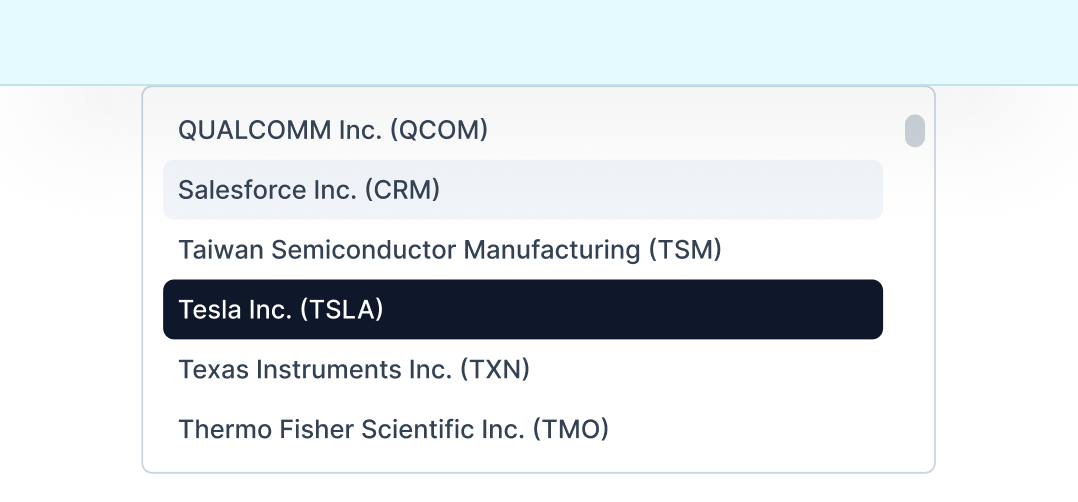
Stocks, crypto, forex, commodities, ETFs - search any ticker, get real data.

A candlestick chart showing stock price movements with a note stating data is from the previous trading day, Friday, November 21, 2025, and markets are closed. Below are time range buttons: 1D (selected), 5D, 1M, 3M, 6M, YTD, 1Y, 5Y, All, and interval options with 15 minutes selected among 5, 15, and 30 minutes.
Custom Time Ranges

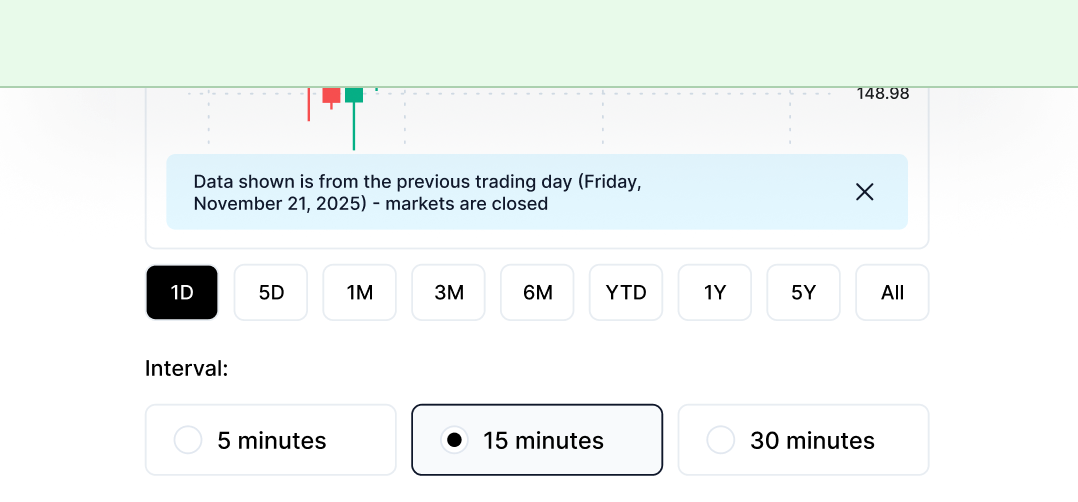
Intraday spikes to multi-year trends - pick the range that fits your design.

Full Design Control

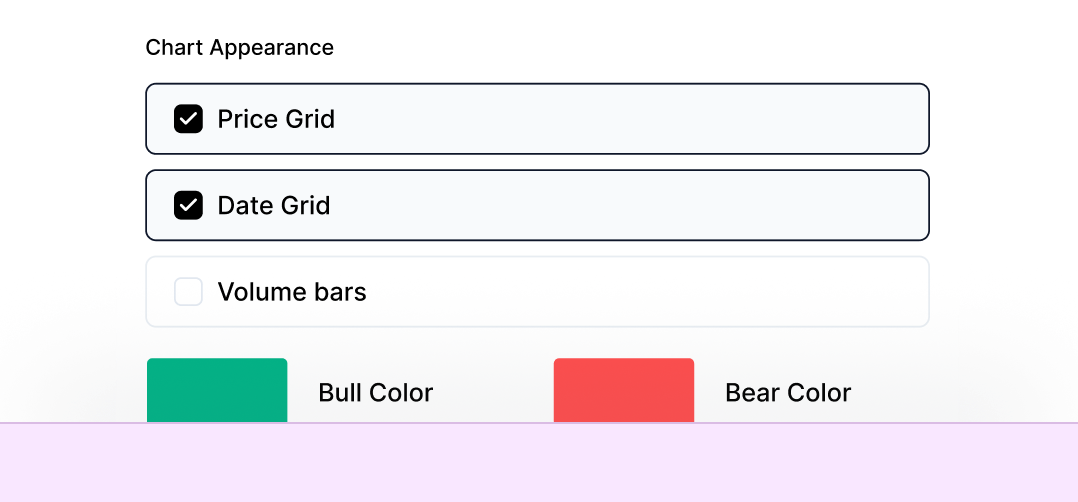
Custom colors, stroke weights, grids, backgrounds. Live preview as you tweak.

Chart appearance settings with checkboxes for Price Grid and Date Grid enabled, Volume bars unchecked, and color selections for Bull Color in green and Bear Color in red.
Two Chart Types

Candlestick or line. OHLC data or clean trends - your call.

Chart appearance settings with checkboxes for Price Grid and Date Grid enabled, Volume bars unchecked, and color selections for Bull Color in green and Bear Color in red.

Built for the moments that matter

For the Designer
If you've ever wasted an afternoon tracing candles from a screenshot, or worse, made up price action that looked "realistic enough" - you know the drill. This plugin gives you actual market data as native Figma vectors. The candles are real. The timeframes are accurate. And the layers are organized so you can actually work with them.
For the Product Owner
Stakeholder presentations and investor decks need to look credible. "Placeholder chart" doesn't cut it when you're pitching a trading platform. Pull real historical data for the exact instrument and timeframe you're discussing. Show Tesla's actual Q3 performance. Display Bitcoin's halving rally. Make the data tell your story.
For Marketing & Content
Market moves fast. Your social content should too. Instead of waiting for someone to screenshot a chart, crop it, clean it up, and send it over - just generate it yourself in 30 seconds. Brand colors, clean vectors, ready to drop into your next post.
Gold price candlestick chart showing a rising trend from December 2024 to December 2025 with a peak value of 4,485.90 against a mountainous background.
Two silver Bitcoin coins in front of red and green candlestick trading charts with text 'Volatility? Bring it on.' and a trading risk disclaimer.
Tesla stock candlestick chart showing rising prices with text 'Power Up with Tesla' on a semi-transparent overlay inside a car interior.
Costs less than 15 minutes of your time. Saves hours every month.
Upgrade to Pro

Questions?

Get the details on features, pricing, and data sources

Is this real market data or just placeholder charts?

Yes. I connected the plugin directly to the Capital.com API - the same data source institutional traders use. When you generate a chart for AAPL or BTC, it pulls actual historical OHLC prices. No fake data, no "Lorem Ipsum" visuals. The data updates daily, so you can always regenerate a chart to get the latest price action.

Can I customize the charts to match my design system?

Absolutely. I built the generator to respect your workflow. You can map Bull/Bear colors to your brand palette, adjust stroke weights, and toggle grids or volume bars. The output is clean, organized native vector layers - not a messy group of random shapes, so you can easily tweak the design after generation.

What happens when I hit my free chart limit?

You'll see a prompt to upgrade to Pro for unlimited access. Your existing charts are yours - they stay in your Figma files and I will never watermark or remove them. You just won't be able to generate new ones until the next month starts, or until you upgrade. You can cancel the subscription anytime.

What if I need a symbol that isn't in the search results?

I've curated hundreds of the most actively traded instruments across Stocks, Crypto, and Forex - the ones we actually use in product designs. If you need a specific ticker for a project, just let me know. I push updates frequently and can usually add requested symbols within 24-48 hours.

How secure is my payment information?

I don't handle your payment information at all - that is 100% Stripe's job. They are PCI-DSS Level 1 certified and process billions for companies worldwide. Your details go directly to their encrypted servers and never touch my system. You can manage your subscription or download invoices through Stripe's secure portal without ever needing to email me.